Cron Jobs
Cron jobs are scheduled tasks that run automatically in Paideia LMS. The admin cron jobs page provides comprehensive visibility into job execution history, allowing administrators to track job execution patterns, debug failures, and monitor system performance.
Overview
Section titled “Overview”The cron jobs feature provides administrators with:
- Job History: View execution history of all cron jobs
- Status Monitoring: See which jobs succeeded or failed
- Error Details: View detailed error messages for failed jobs
- Execution Tracking: Monitor job execution timestamps and patterns
Accessing Cron Jobs
Section titled “Accessing Cron Jobs”To access the cron jobs page:
- Log in as an administrator
- Navigate to Admin → Server → Cron jobs
You’ll see a comprehensive view of all cron jobs and their execution history.
Job History Display
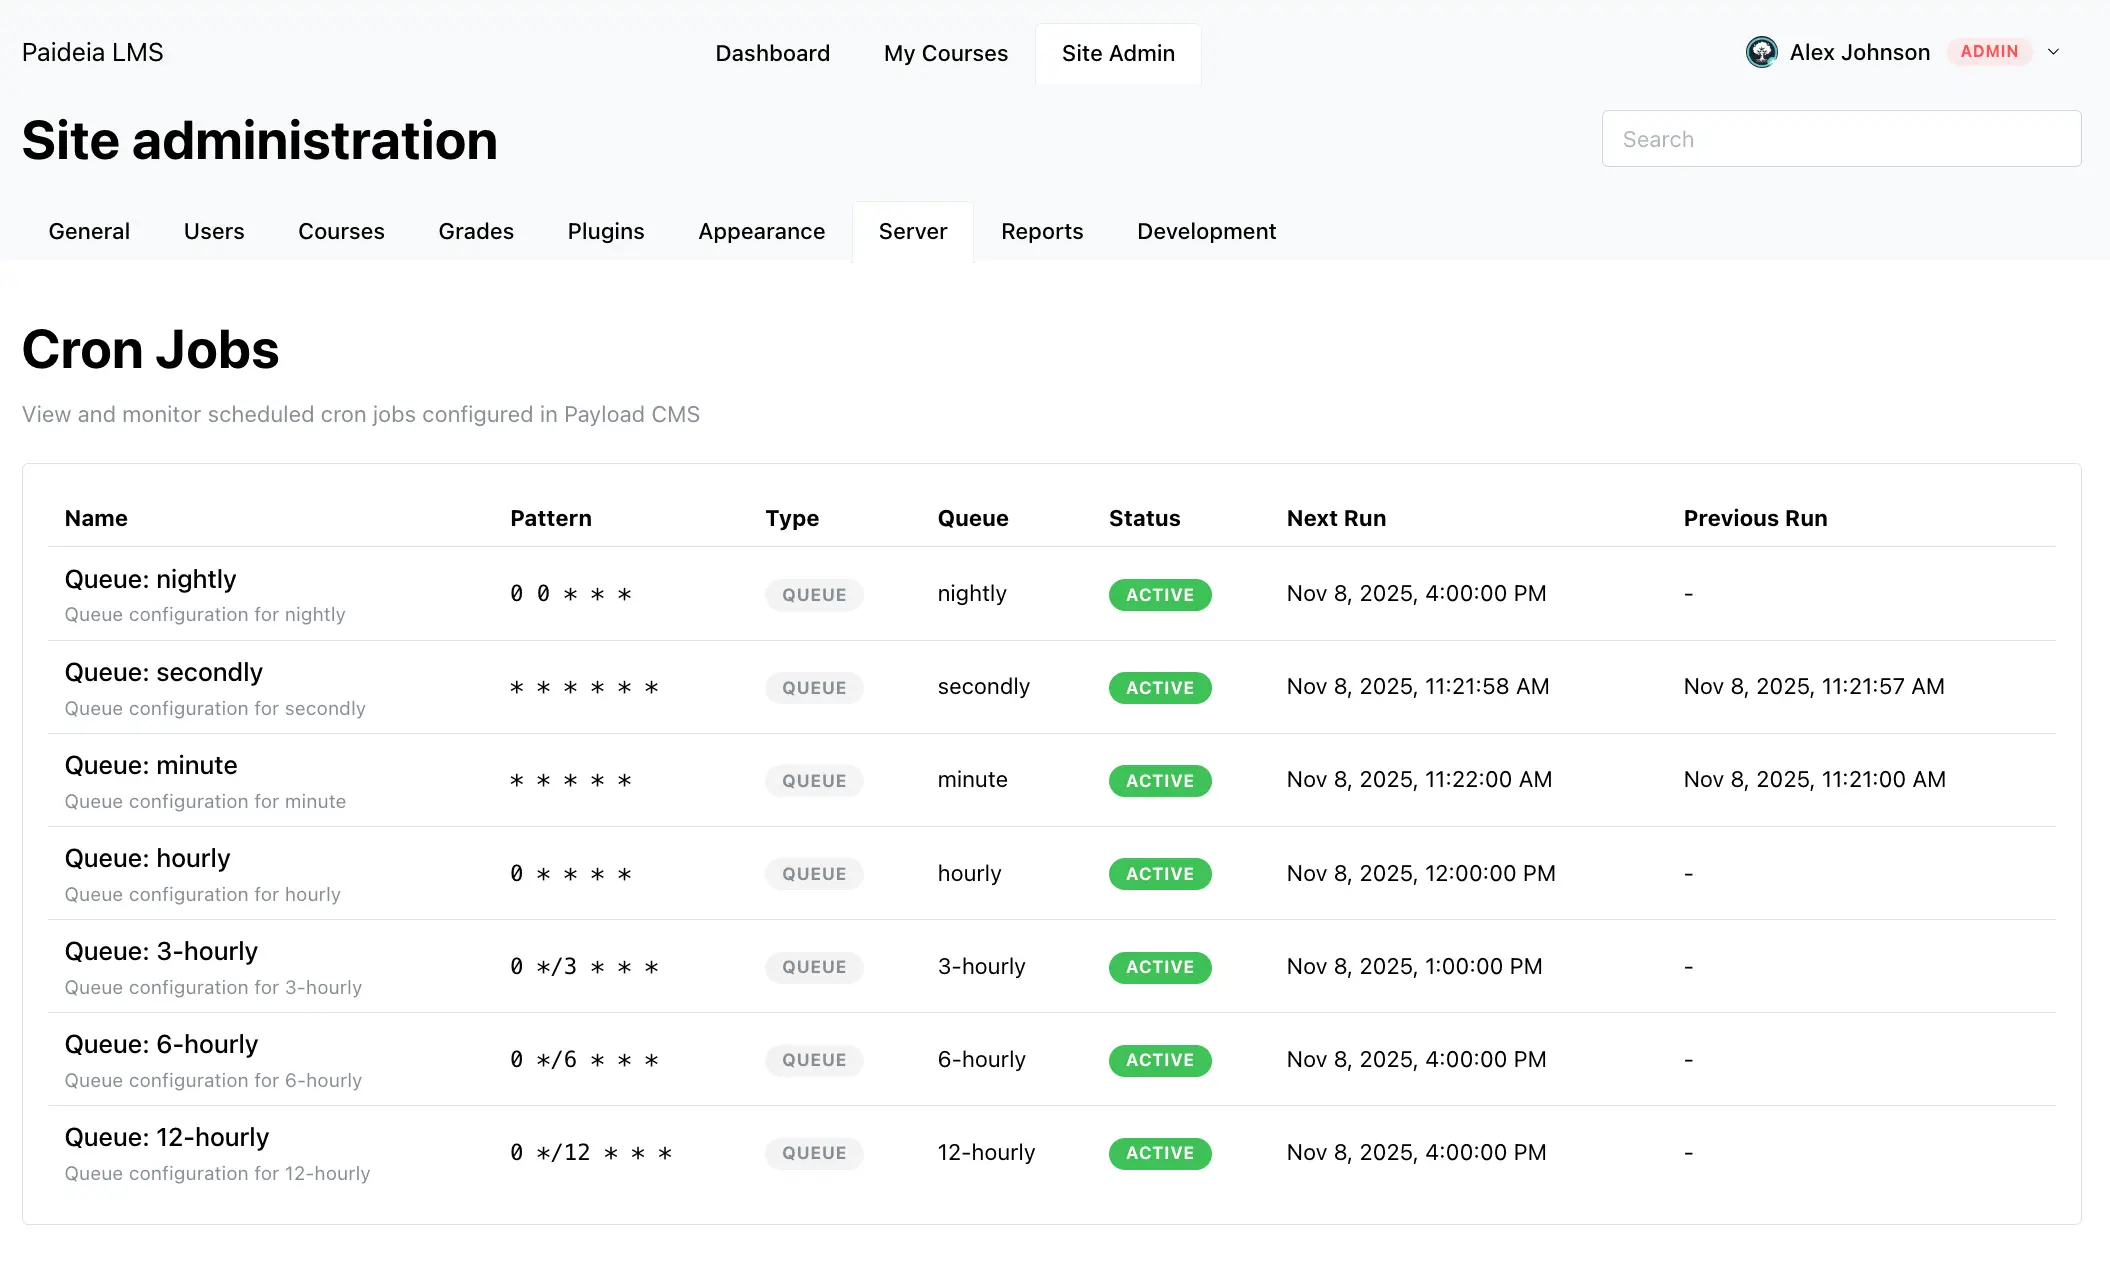
Section titled “Job History Display”The job history table displays detailed information about job executions:
Table Columns
Section titled “Table Columns”- Job Name: The name of the job (derived from task slug or queue)
- Task Slug: The task identifier
- Queue: The queue name
- Executed At: When the job started execution
- Completed At: When the job finished execution
- State: Job execution status (Succeeded or Failed)
- Error: Error message for failed jobs
Status Indicators
Section titled “Status Indicators”- Green Badge: Job succeeded
- Red Badge: Job failed
Error Display
Section titled “Error Display”Failed jobs display detailed error information:
- Formatted Display: Errors are displayed using CodeHighlight component
- Copy Functionality: Easy to copy error messages for further analysis
- Format Support: Supports both string and JSON error formats
- Readable Format: Errors are formatted for better readability
Understanding Job Execution
Section titled “Understanding Job Execution”Successful Jobs
Section titled “Successful Jobs”Successful jobs show:
- Green status badge
- Execution timestamps
- Completion timestamp
- No error message
Failed Jobs
Section titled “Failed Jobs”Failed jobs show:
- Red status badge
- Execution timestamps
- Completion timestamp (if available)
- Detailed error message
Database Integration
Section titled “Database Integration”Job history is retrieved directly from the database:
- Source Tables:
payload_jobsandpayload_jobs_log - Query Method: Uses Drizzle ORM for database queries
- Left Join: Includes all jobs, even when log entries don’t exist
- Fallback Logic: Handles cases where logs may not exist
PostgreSQL Behavior
Section titled “PostgreSQL Behavior”PostgreSQL only creates log entries in payload_jobs_log for failed jobs. The query uses a left join to ensure all jobs are included in the history, even when log entries don’t exist.
History Limit
Section titled “History Limit”The job history is limited to prevent performance issues:
- Default Limit: 100 entries
- Sorting: Most recent jobs first
- Configurable: Limit can be adjusted in the function
Common Use Cases
Section titled “Common Use Cases”Monitoring Job Execution
Section titled “Monitoring Job Execution”Use the job history to:
- Track job execution patterns over time
- Identify jobs that fail frequently
- Monitor system performance
- Understand job execution status
Debugging Failed Jobs
Section titled “Debugging Failed Jobs”When a job fails:
- Check the job history table
- Find the failed job (red badge)
- Review the error message
- Copy the error for further analysis
- Investigate the root cause
Performance Monitoring
Section titled “Performance Monitoring”Monitor job execution to:
- Identify slow-running jobs
- Track job execution frequency
- Monitor system load
- Optimize job scheduling
Best Practices
Section titled “Best Practices”Regular Monitoring
Section titled “Regular Monitoring”- Check job history regularly
- Monitor for failed jobs
- Review error messages
- Track execution patterns
Error Analysis
Section titled “Error Analysis”- Copy error messages for analysis
- Review error details carefully
- Check system logs for additional context
- Investigate root causes
Performance Optimization
Section titled “Performance Optimization”- Monitor job execution times
- Identify slow-running jobs
- Optimize job scheduling
- Adjust job frequency if needed
Troubleshooting
Section titled “Troubleshooting”Jobs Not Appearing in History
Section titled “Jobs Not Appearing in History”If jobs don’t appear in history:
- Check that jobs are actually running
- Verify database connectivity
- Check system logs for errors
- Verify job configuration
Missing Log Entries
Section titled “Missing Log Entries”If log entries are missing:
- This is normal for successful jobs in PostgreSQL
- The system uses fallback logic to show job information
- Check the
payload_jobstable directly if needed
Error Messages Not Displaying
Section titled “Error Messages Not Displaying”If error messages aren’t displaying:
- Check that the job actually failed
- Verify error format (string or JSON)
- Check browser console for errors
- Verify CodeHighlight component is working
Related Features
Section titled “Related Features”- Maintenance Mode - Restrict system access during maintenance
- Configuration Guide - Learn about system configuration
- Environment Variables - Configure system settings